HeidiSQL, Apache Hop, MariaDB, Datawarehouse, ETL
|
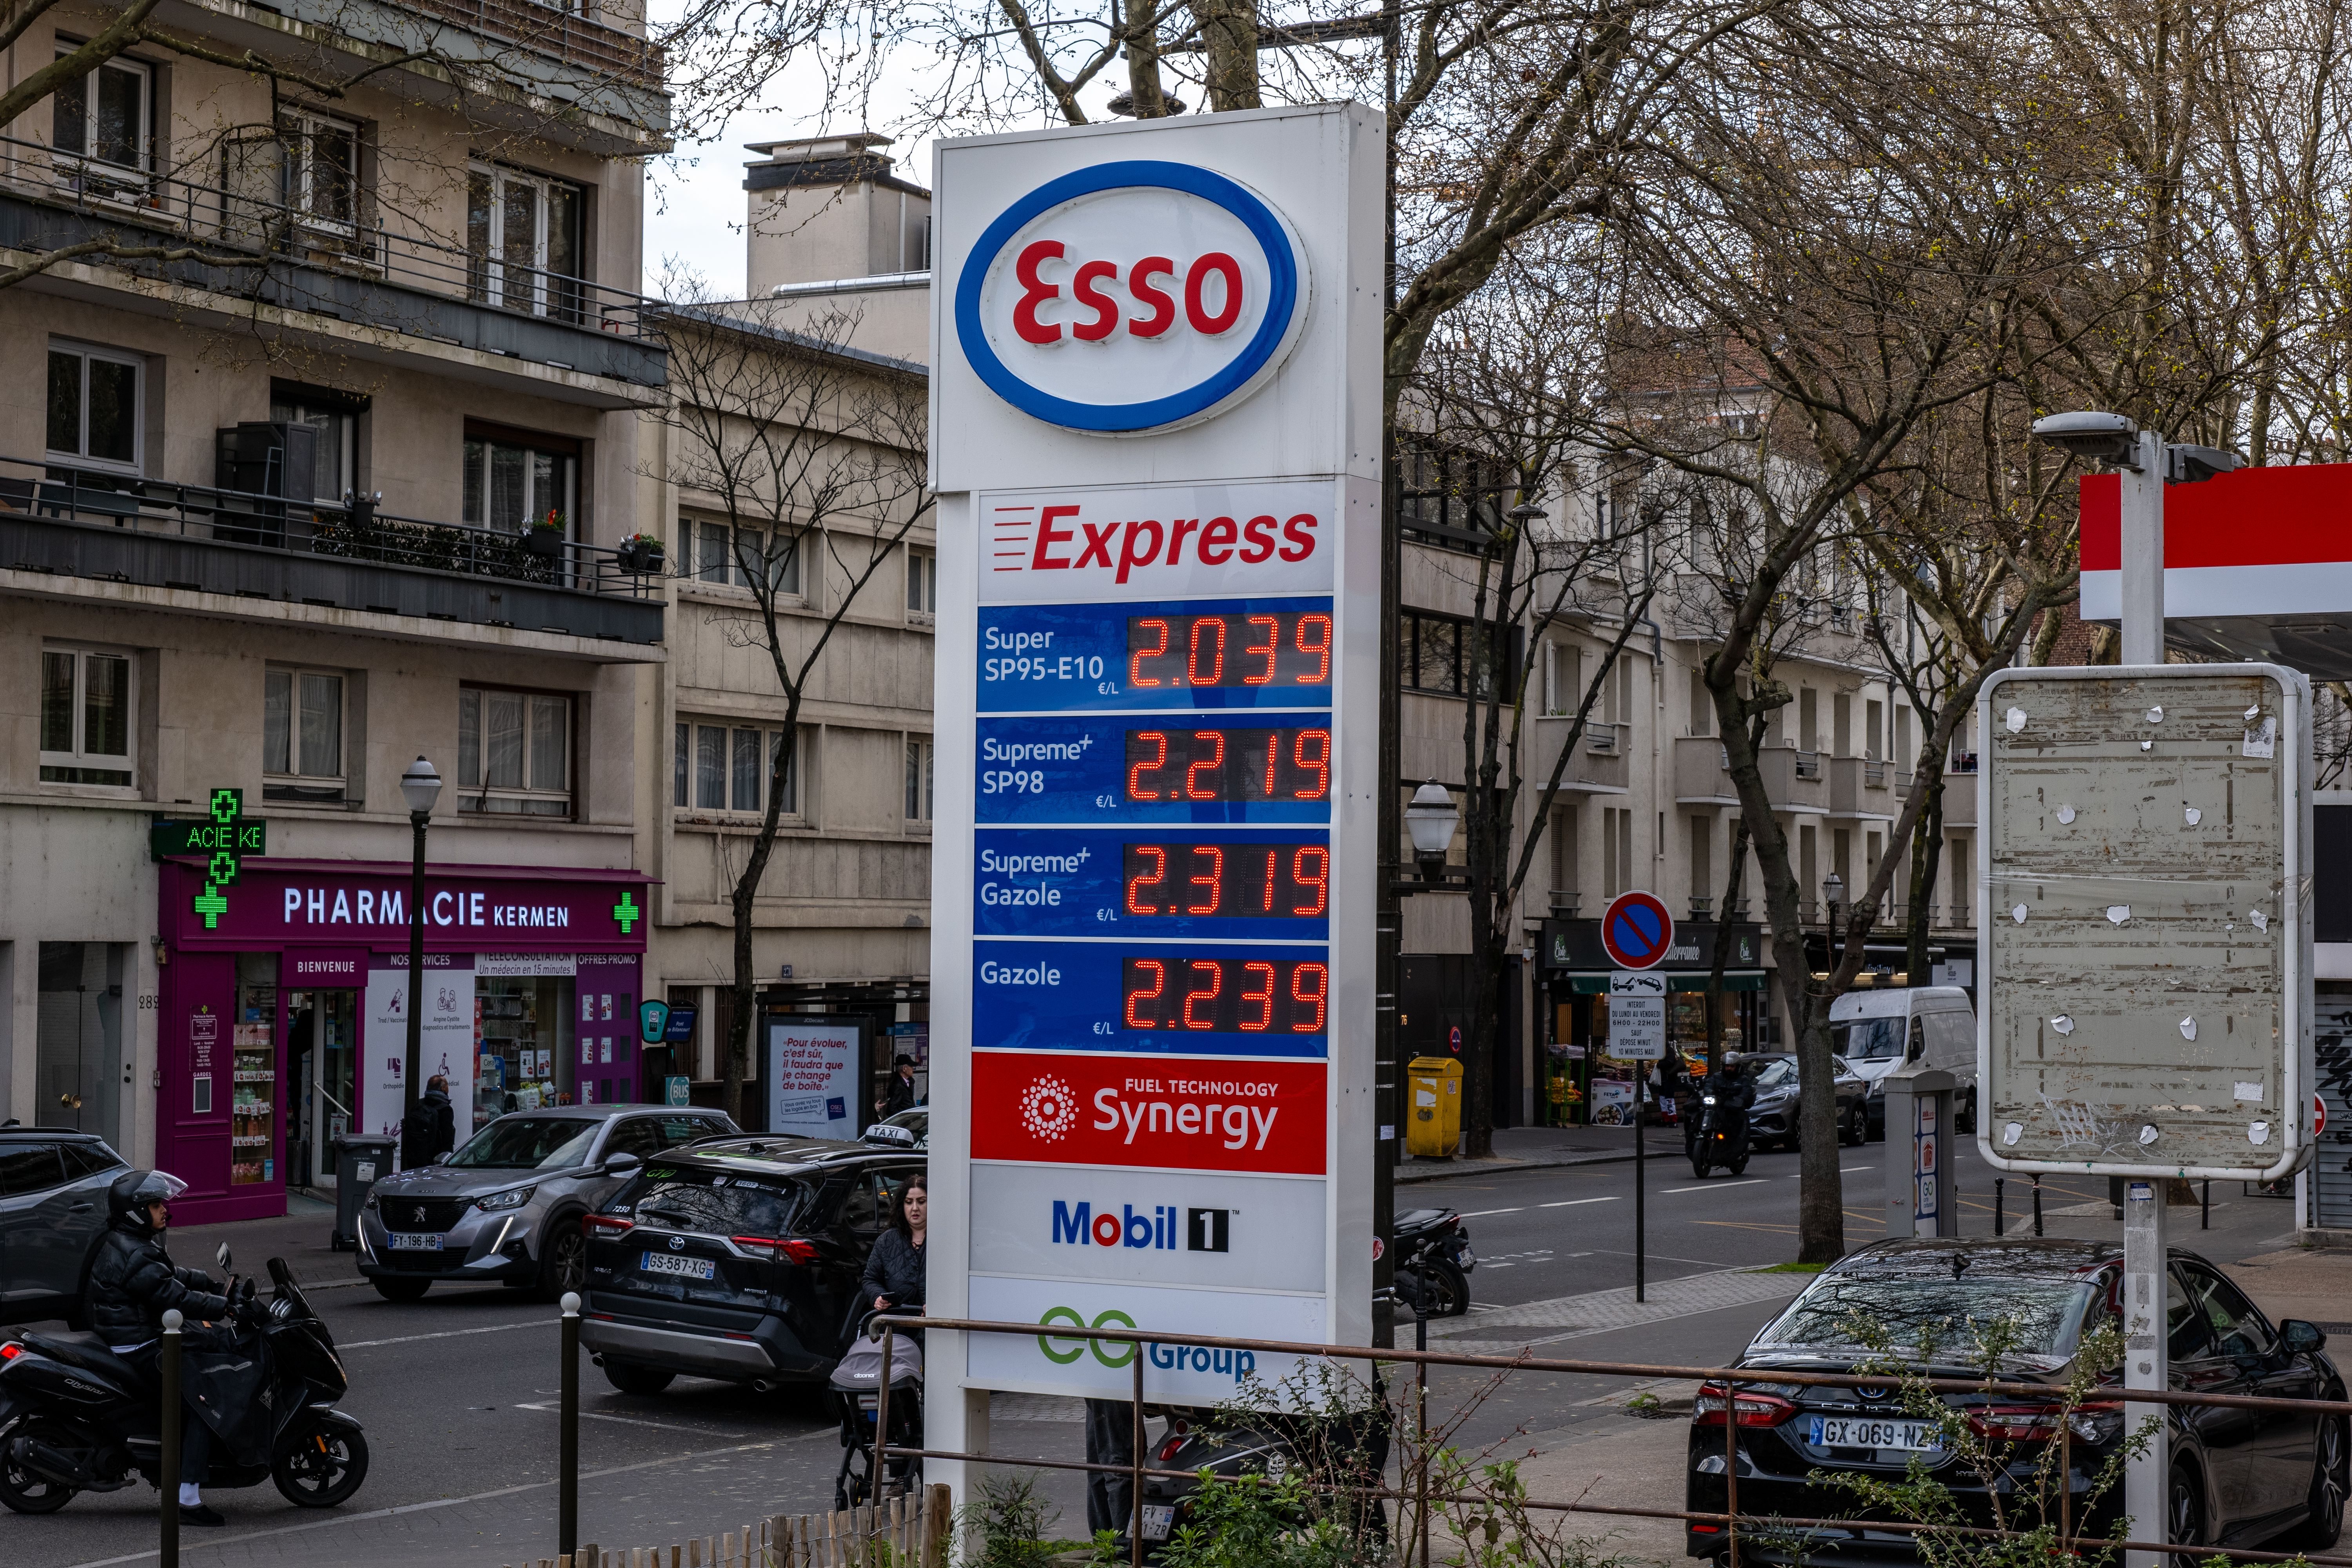
Data : to start, I have access to an XMLfile from the national institute of statistics
regarding gas prices, the problem being the way data is stored in the XML file doesn't
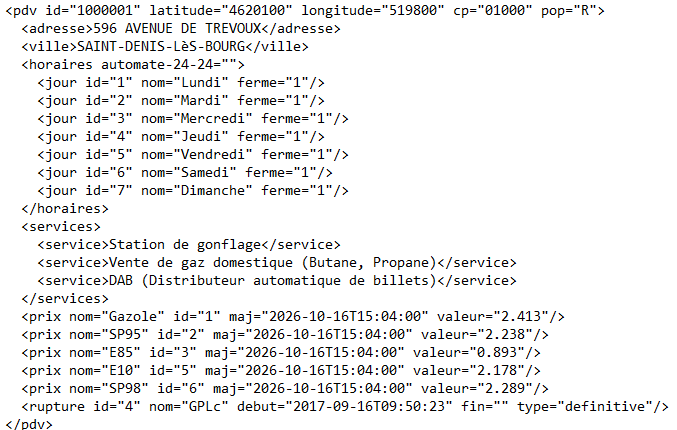
correspond to the table I want to have in my database. Context : the goal here is to initiate a datawarehouse conataining for each date gaz prices in each gaz station in France. The problem is the way data is stored inside the XML file doesn't correspond to the table we want to obtain (XML file on the side). |
|
|
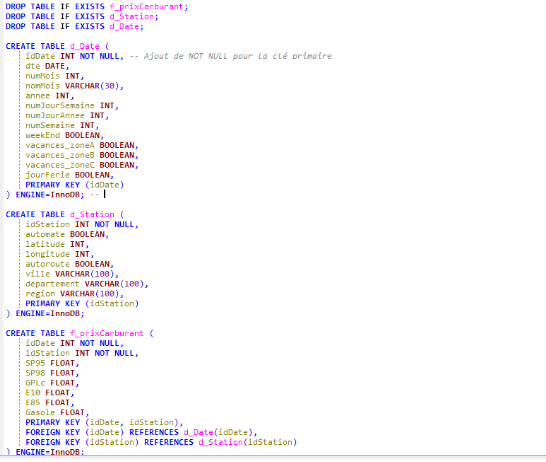
Before launching Apache Hop to configure the pipelines , I create the database using Heidi SQL,
I will next connect the base to Apache Hop, the base is hosted on MariaDB.
I need three tables : two dimensions tables, d_date and d_station and one fact table f_carburants(
containing the gaz prices
). I add DROP TABLE at the beginning to erase the table then re create it to be able to test the pipelines several times. |
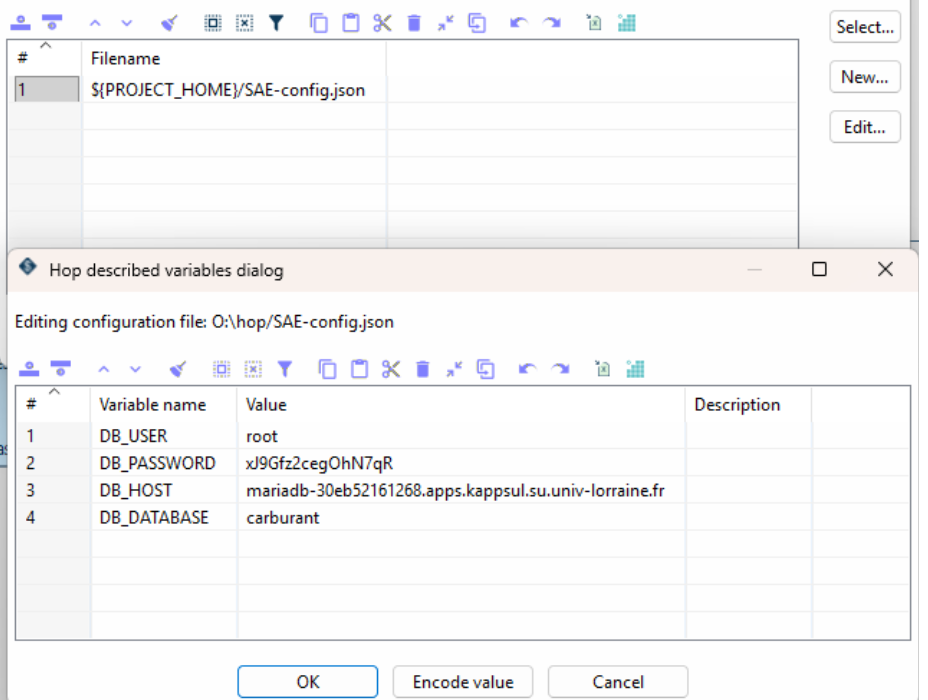
| After that, I create a developping environment in Apache Hop and make the variables corresponds with my heidiSQL database values in order to be able to link the base to Apache Hop. Then, I use the metadata function Relational Database in Apache Hop to link the database , this will allow me to fill the table with data. |
|
|
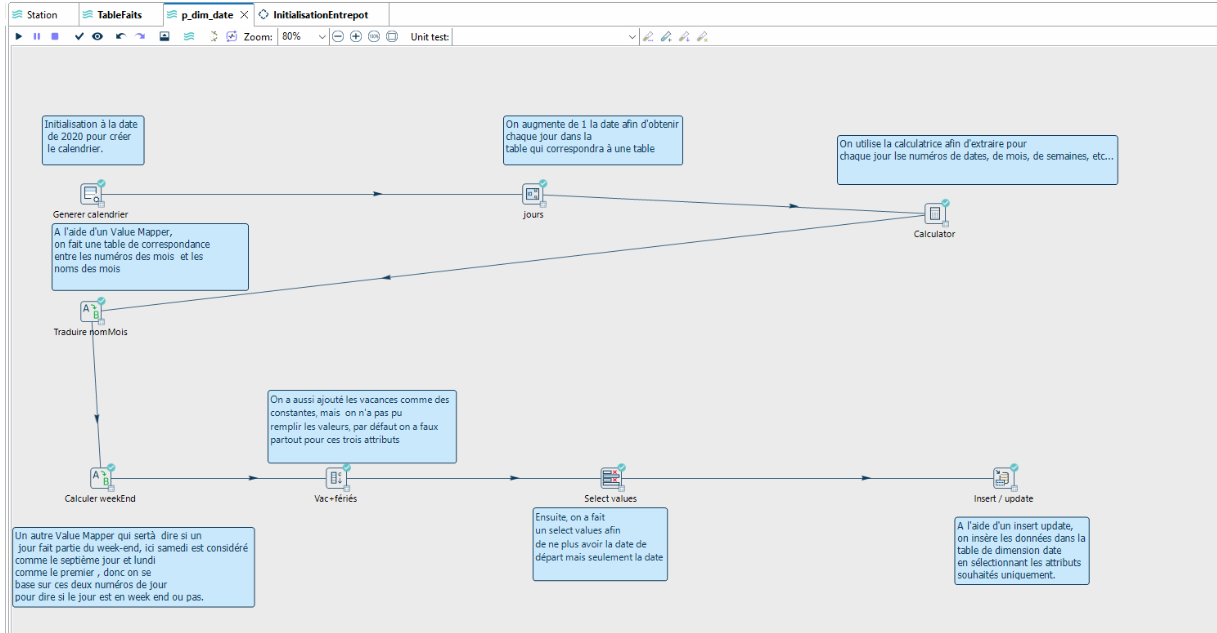
The first step is generating the calendar that will help us fill the date table. For
this step no need to use an external file, the software functions are enough.
I initiate the date to first january 2020 and go up by one 10 000 times for each row to be sure to
get to today's date. I started at 2020 because some prices haven't been updated since.
The most important step here is using the calculator to extract each element
from the date, using the complete date we automaticaly get the number of the week,number of month,
the year, etc... Using a value mapper I make a corresponding table between the number of the month and the name of the month. I create another one to show week-end when the price is on a saturday or a sunday, here these are day 7 and 1, so the condition is the day is either number 7 or 1. Finally, I use an insert/ update to insert data into the date Table, while carefully chosing which elements take. |
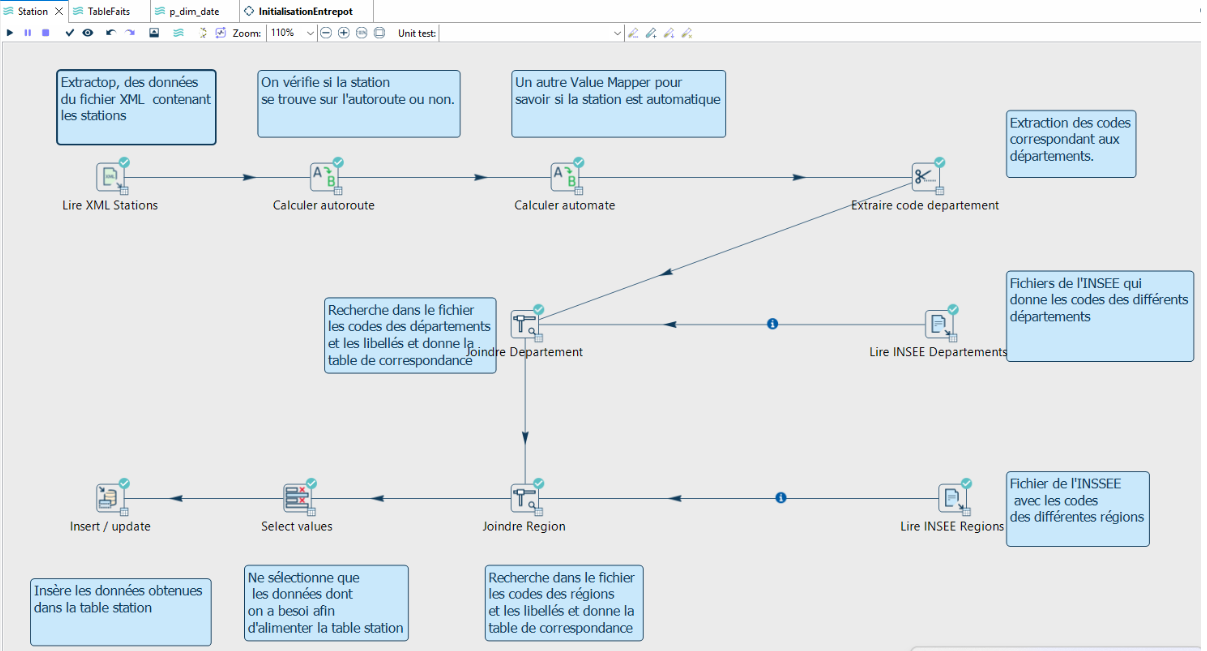
| Now that the date Table is filled , I can proceed with the filling of the station table. The hardest part here was extracting the department's and regions' codes from the XML file. This step can be more delicate thant the previous one since it was needed to import a lot of data, it is really important to pay attention as to how the files and folders are organised because it can quickly become impossible to extract date or have an error without knowing why. |
|
|
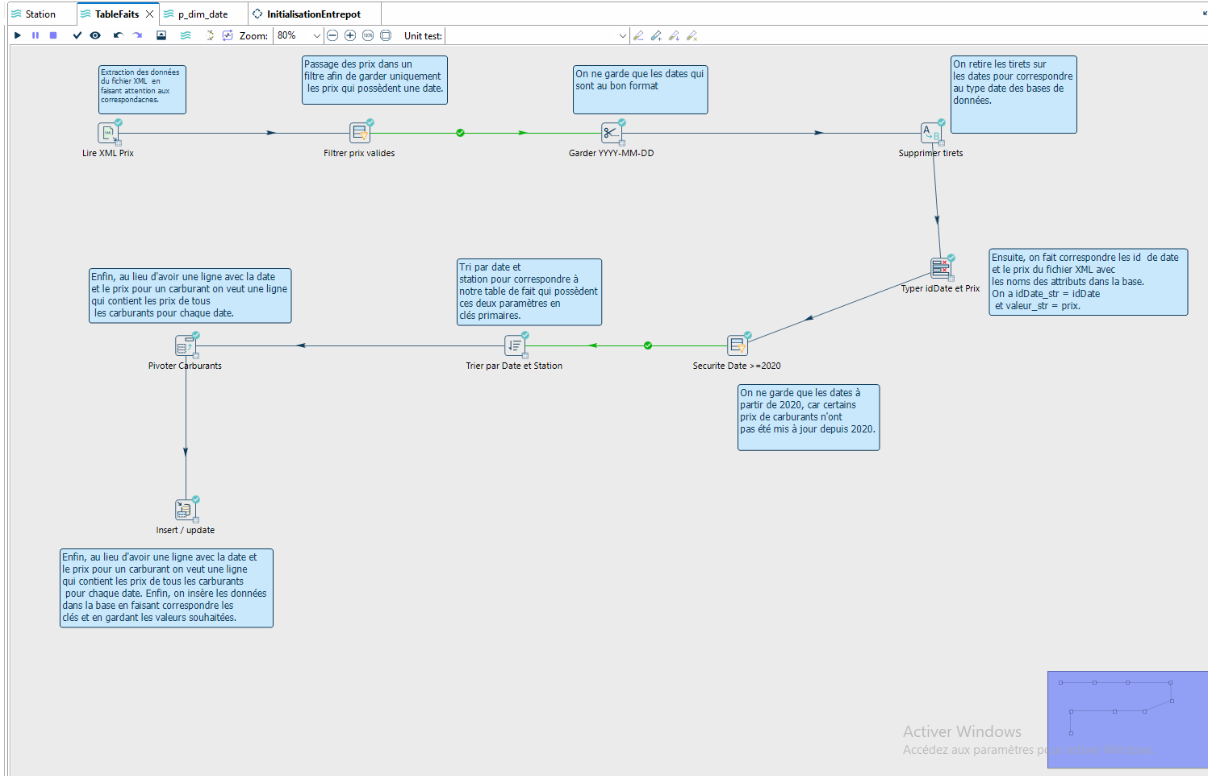
Finaly, I fill the facts Table f_prix Carburant which contains gaz prices for each station for each date. What was the hardest here was getting the price of each fuel on one line instead of having a line by fuel by station like on the XML file. Paying attention to date was also important, that's why the fist filter only keeps the prices which have a date. It was also important to take out the dashes to have the right date format for a database. After that, I order by station and date to correpsond to the facts table that has the two as its primary keys. After that, the next step is to rotate the values, which will make it so we get all the prices for a date and a station on one line instead of one fuel by line. Finally, I make the keys correspond to fill the table |
|
|
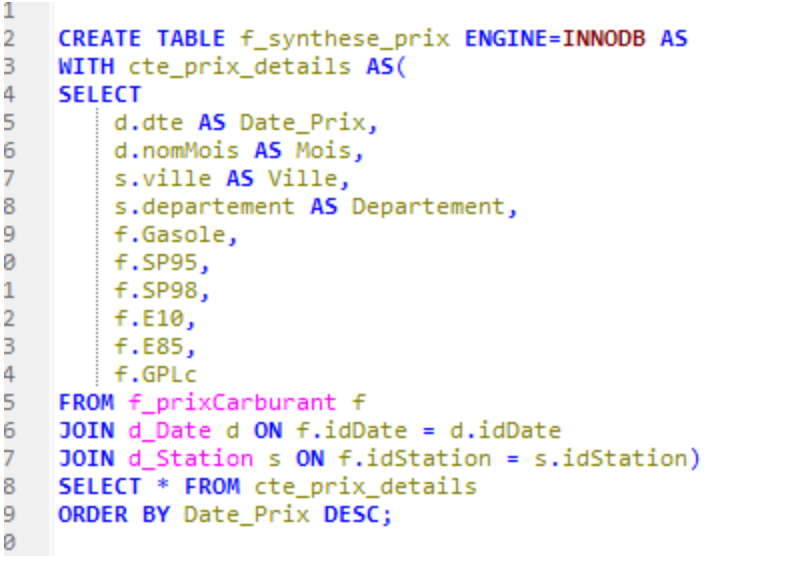
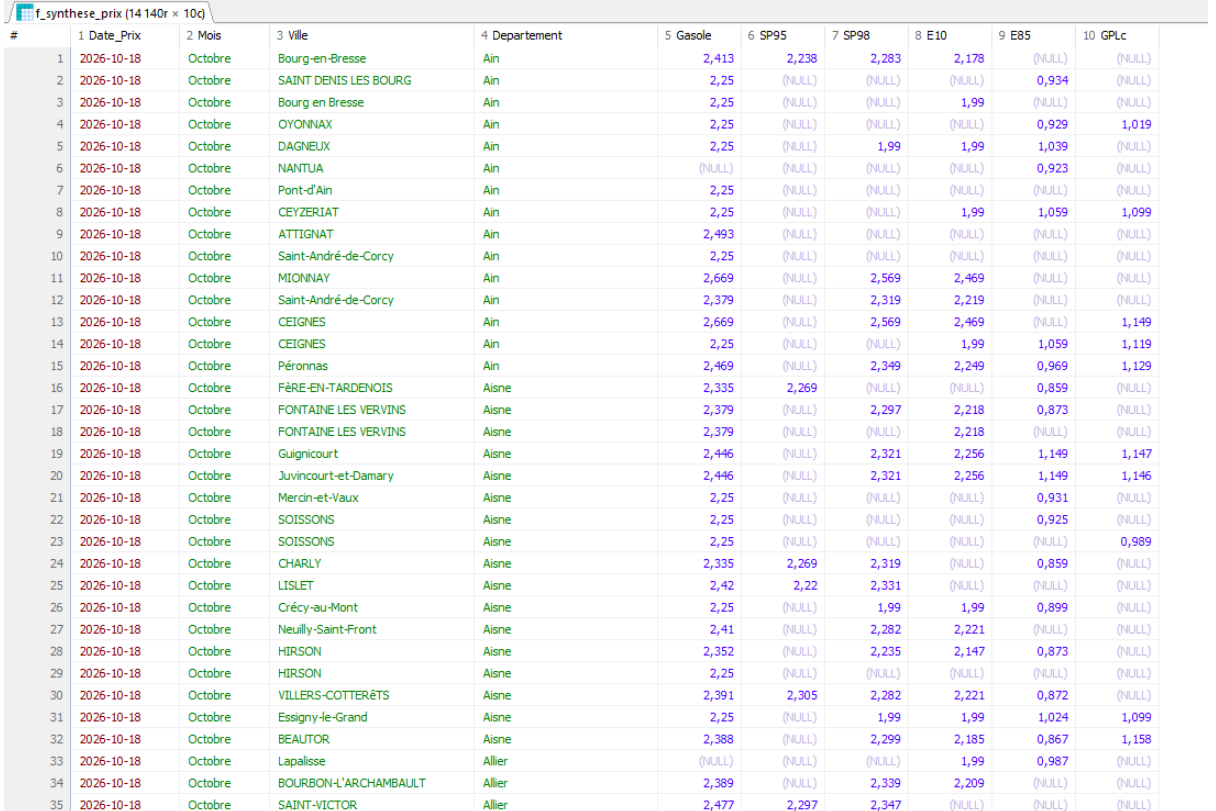
I set up a synthesis table in order to directly get the data that interests me every time the warehouse is updated. I ordered by date in descending order to be sure to have first the prices that re known, the ones who have been updated the most recently, when I didn't specify and it started in 2020 a lot of values were missing. It's containing these attribute : date , month, city, department and the price of each fuel. |
|
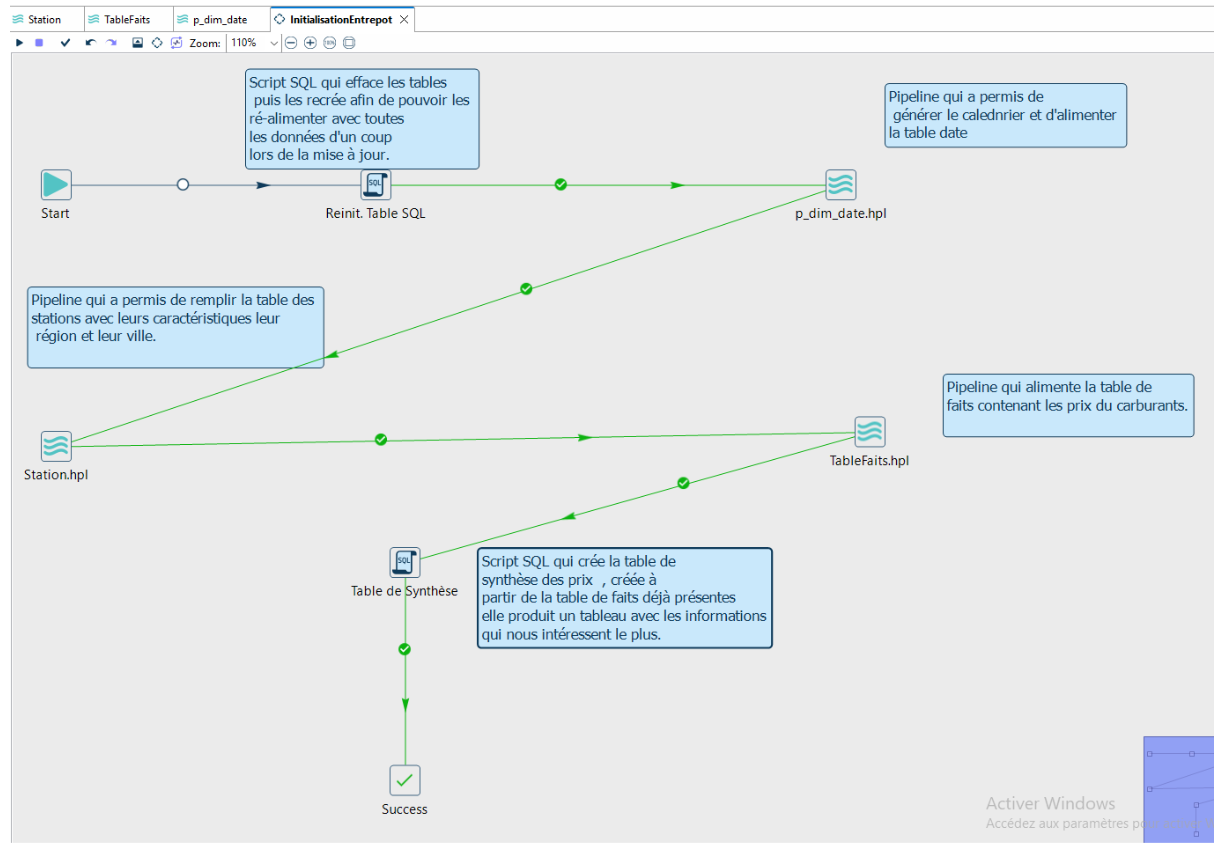
The initialization workflow allows to immediately load the data available in the warehouse when it's launched. The first step erases the tables if they exist and create them again so they are empty and ready to receive data. Then, the three pipelines created earlier are activated, the order is really important : if the date Table and station Table are empty it's impossible to insert data into the prices Table. Finaly, the SQL script used to create the synthesis table is used again and adds the condition that it will be erased if it already exists like for the other tables, and the last step fill the synthesis table. |
| The final result is the table wanted, the prices for each fuel and the date. It's possible de make operations either on month or price. A lot of values are missing for carburants that aren't gasoile(diesel), for some stations, only the price of one or two fuel is available. |
|