|
Context: we have a group of fish that we want to use to set up lineray regression models
that will estimate the weight of the viscera using either the diameter or the transversal length?
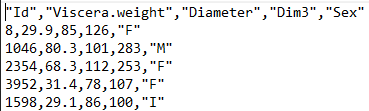
Data: we have a csv file containing several caracteristics of the fish: Viscera.weight, Diameter, Transversal length and sex. You can see on the side the picture of the csv where we can see on the first line the title separated with ; and on the rest of the file one line by fish with each caracteristics separated by a , . |
|
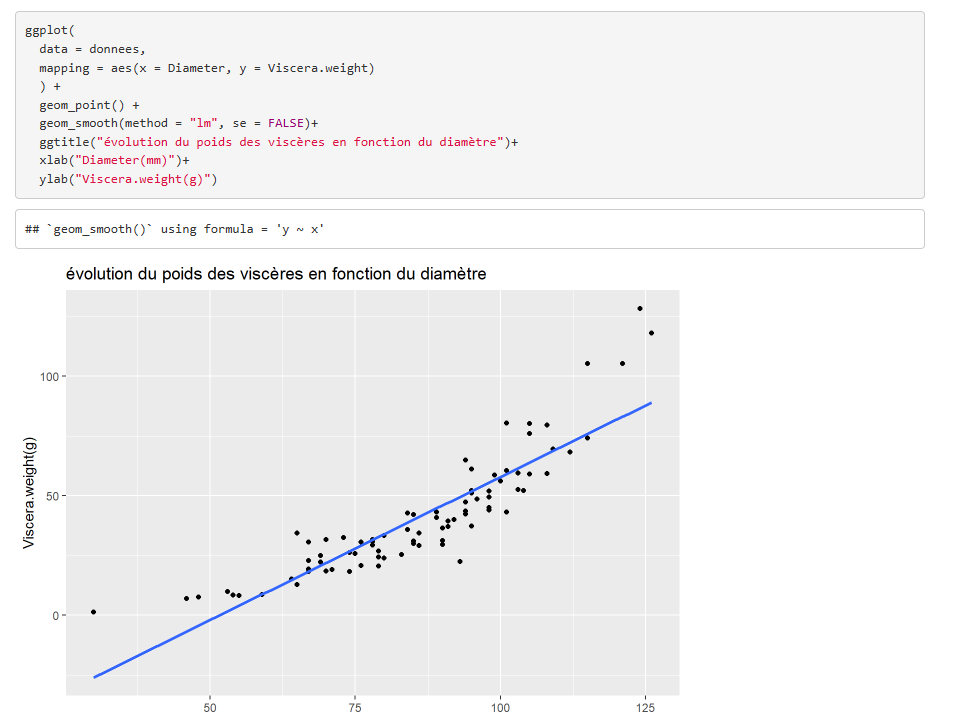
| We start by tracing a graph that allows to directly see if the correlation is non-existent. On the other hand, we can't conclude that the variable are correlated just because of the graph. Here, the variables seem to be correlated, but the line doesn't follow the points, they rather form a curbe, in order to get a curve, we can put the data into the logarithmic function. |
|
|
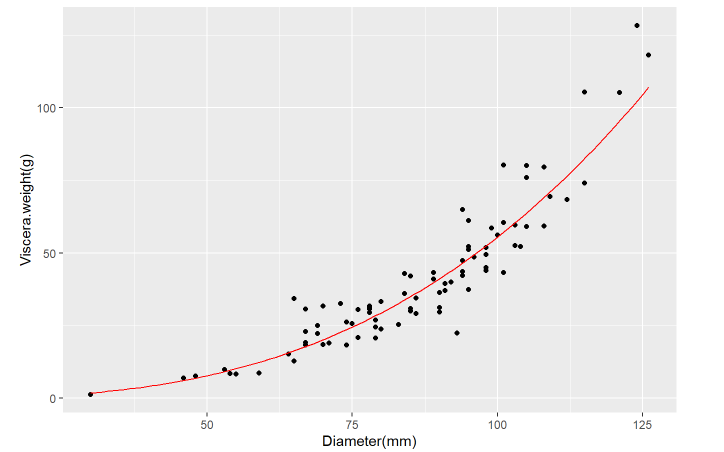
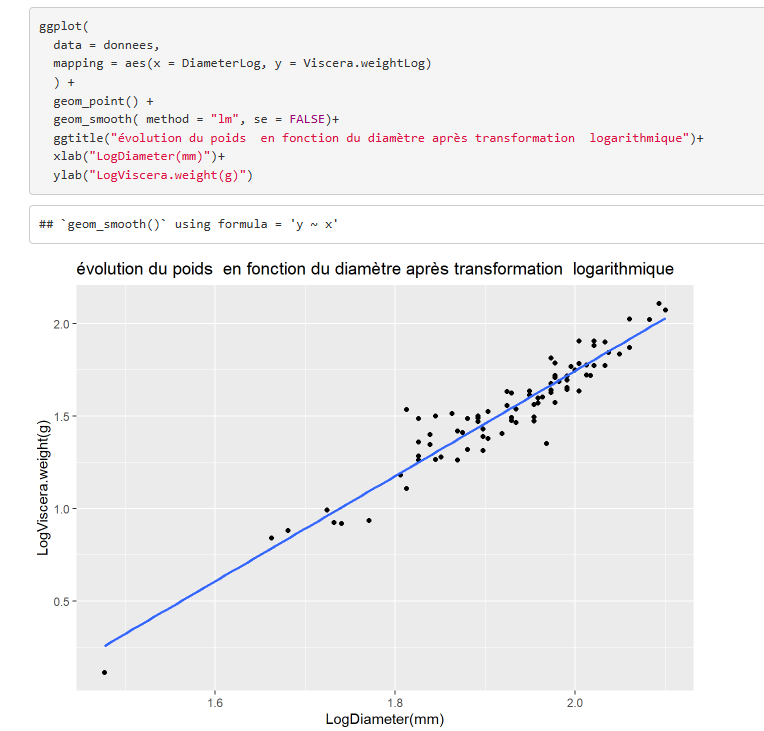
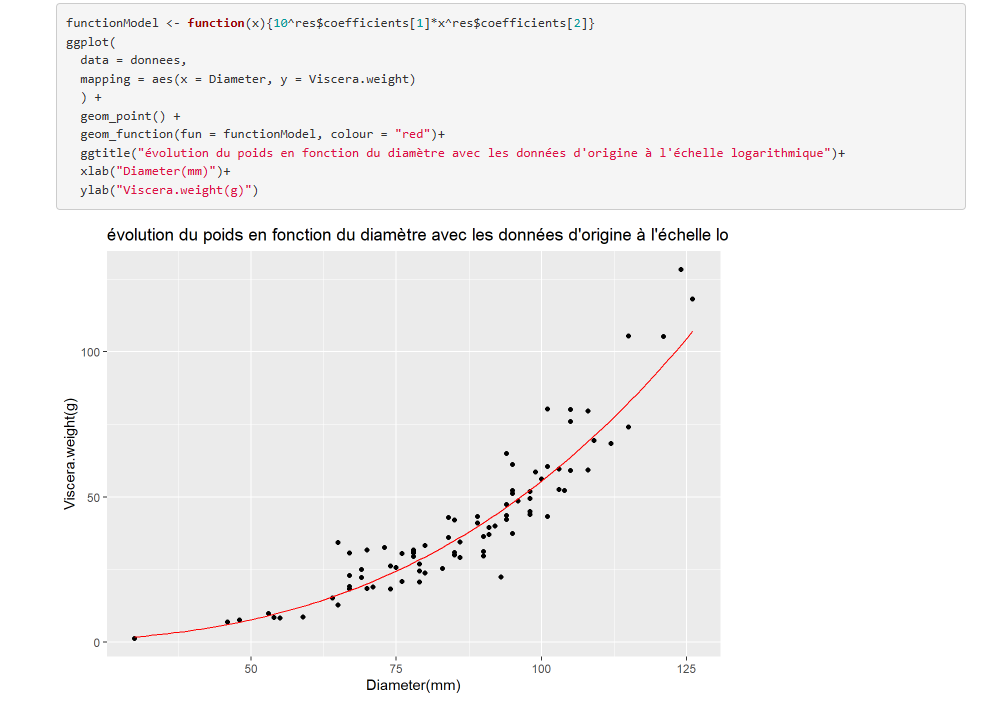
| It's now easier to see the links between the variables , the point are around the tend curv, we re-use the original data and put them to the logarithmic scale (graph below). To get this curve, the function Function Model is used and we apply the coefficients of the results of the lineary model calculation who was calculated using the logarithmic data. |
|
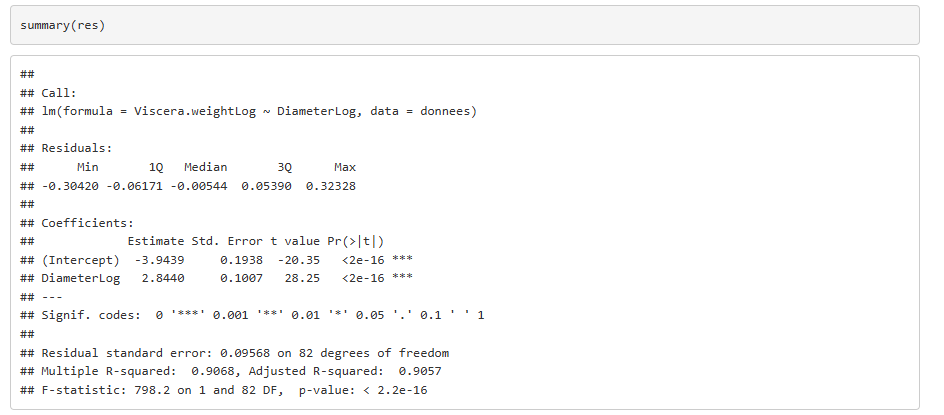
Finally, after visually showing that the two variables can be correlated , I print the
summary of the calculation of the lineary model. I take Estimate Intercept for the Intercept
and Estimate of DiameterLog to find the slope coefficient. Therefore, the model gives us Viscera.weightLog = 2,844*DiameterLog -3.943 This means that each time DiameterLog goes up by one Viscera.weightLog goes up by 2.844. The determination coefficient R² is worth 0.90 which means that 90% of the variance of Viscera.weightLog is explained by DiameterLog. |
|
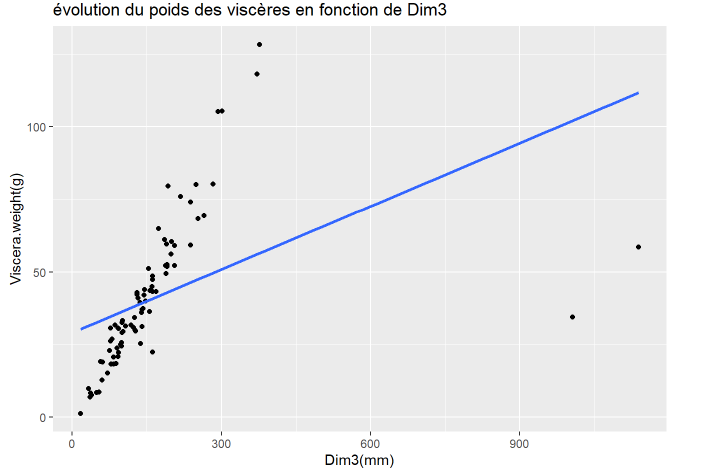
Onto the second explainetive variable : dim3 which corresponds to an angle of measurement that is not
explained. The graph shows that most of the points follow a trend but the line doesn't follow them because of the two outliers, absurd values that are worth way more than the rest and distort the results. |
|

|
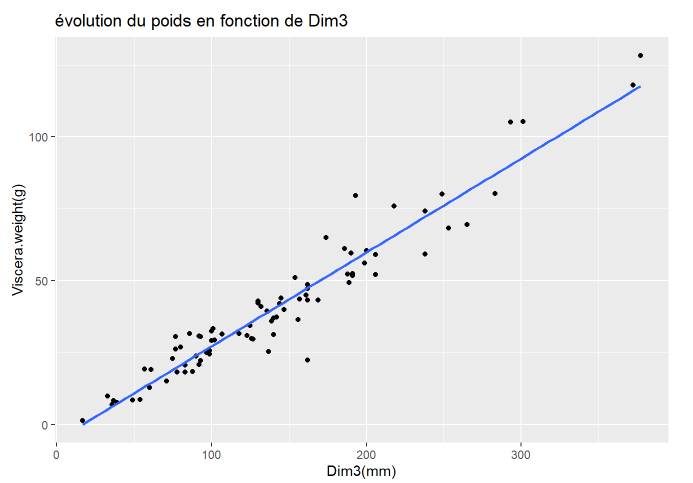
I used subset to take out the absurd values then re drew the graph with the new data and now I get a tendance line which has most points around it. |
|
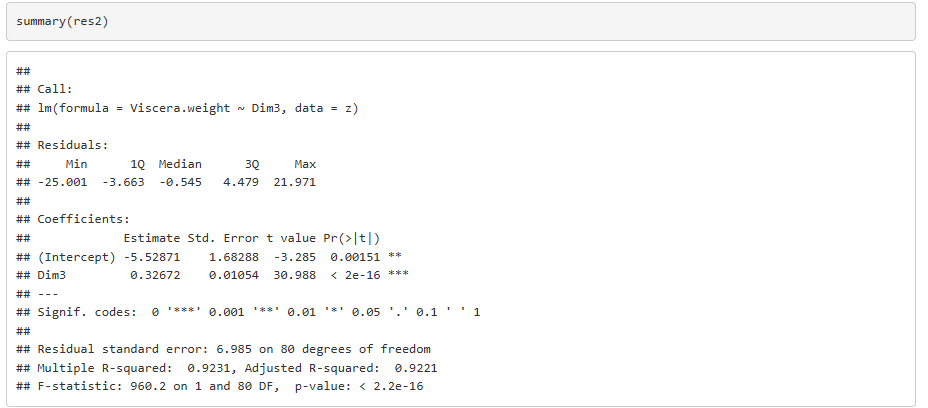
I calculate the regression model using the new data, then I print the results of the summary of the calculation
to establish the model like previously, it gives me this formula Viscera.weight = 0,326*Dim3 - 5,52 I can see on the summary that R² is worth 92,21% which means that more than 92% of the variance of the weight of the viscera is explained by Dim3. This means that every time Dim3 goes up by 1 Viscera.weight goes up by 0,326. |

|